Adding icon columns to DataTables with FontAwesome
Posted: September 14, 2016 Filed under: Uncategorized Leave a commentIf you are modernizing a Notes/Domino application, chances are there are many underlying views that make use of column icons, which have always been one the great little features that users really loved about Notes. As Domino web apps became more prevalent, you could even create img tags that pointed to the icon source files on the server (oooohhhh!).
In the modern app world you are probably using icons that are more … modern, such as Font Awesome.
If you are using jQuery DataTables as well, then it is incredibly easy to add much more functional column icons to your DataTable using a Renderer.
Note: this article assumes the reader has an understanding of how a DataTable is configured using the columns object.
For a primer, refer to my MWLUG session slides, the accompanying demo database, the online demos, or the DataTables website. This example builds on the demos.
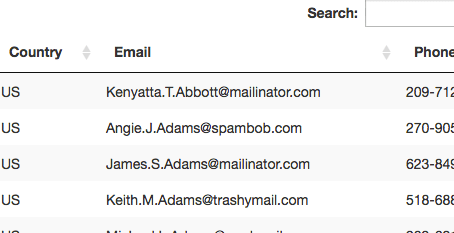
The example below takes the email column and turns it into an icon that, when clicked, will launch a new mail message addressed to the person listed on that line.
We want to turn this:
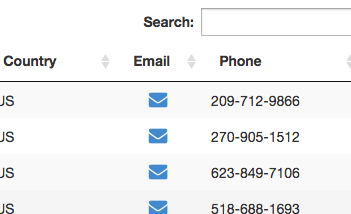
Into this:
1.) Setup the view data source that feeds the DataTable.
This can be done by adding a new column to the datasource that contains a JSON string. This is personal preference – you can setup the column however you wish. The important thing is passing the data needed to render the icon to DataTables.

The JSON string in my new column has three properties:
- renderer – has the value “getIcon”.
- icon – this property contains the class(es) of the Font Awesome icon to be used.
- data – this is the raw email address. We want to include this for filtering and sorting.
2.) Now that the data source is setup, update the columns object of our DataTables initilization:
In previous examples our columns object looked like this:
var columns = [
{
	data:"colName", // which property in the json object to pull data from
	title:"Name"	// text to appear in the column header
},
{data:"address",title:"Address"},
{data:"city",title:"City"},
{data:"state",title:"State"},
{data:"zip",title:"Zip"},
{data:"country",title:"Country"},
{data:"email",title:"Email"},
{data:"phone",title:"Phone"}
];
Now, we are replacing the “email” entry with a new entry that will render the Font Awesome icon by using the “render” property of the columns object:
var columns = [
{
	data:"colName", // which property in the json object to pull data from
	title:"Name"	// text to appear in the column header
},
{data:"address",title:"Address"},
{data:"city",title:"City"},
{data:"state",title:"State"},
{data:"zip",title:"Zip"},
{data:"country",title:"Country"},
{data:"colIconEmail", // this is replacing "email"
 title:"Email",
 width:"50px",
 render:function(data, type, row, meta) {
	// check to see if this is JSON
	try {
	   var jsn = JSON.parse(data);
	} catch(e) {
	   console.log("error parsing json - " + e.toString());
	   return jsn.data;
	}

	if (type == "display") {
		// this is the value that will be used to display what
		// the user sees

		// we want to display a clickable icon
		if (jsn.renderer == "getIcon") {
			// first get the font awesome markup
			icon = "<i class='fa " + jsn.icon + "'></i>"

			// second, wrap some additional markup to provide
			// formatting and click, etc.
			return "
”
		}
	} else {
		// this is the value that will be used for everything
		// else - filtering, sorting, etc
                // i.e. user@mail.com
		return jsn.data;
	}

 }
},
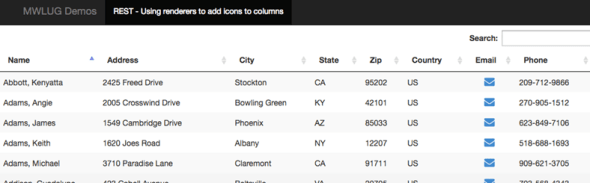
Our view that utilizes the renderer now shows an icon in the email column:
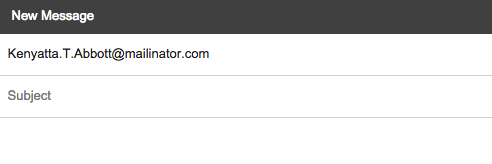
Clicking on one of the mail icons launches a new memo:
Even though our email column is now displaying an icon instead of an email address, we can still filter on email address due to DataTables’ handling of orthogonal data. By filtering on the domain spambob.com, we get only the records that have an email address with that domain.

The working demo for this example can be found here.
Even though this is a fairly basic example, it is incredibly easy to add icons to views created with DataTables – it was simply 2 additional steps. This is only the tip of the iceberg for both Renderers and View Icon Columns.
Demo database from my MWLUG session
Posted: September 8, 2016 Filed under: Uncategorized 7 CommentsAt MWLUG in August, I presented on using jQuery DataTables with XPages. I finally got the demo database(s) I used in the presentation tidied up and ready for download. Some additional demos have been added since MWLUG.
Better late than never, right?
Get the download here: mwlug-demos
Contents of the zip file:
| datatables.nsf | Contains all demo XPages, resource files, and scripts |
| rest.nsf | Contains REST services and XAgents used by DataTables |
| fakenamesdemo.nsf | Data source – this is the Fake Names database made available by David Leedy. Some modifications have been made for the purpose of these demos |
To get the demo database working:
- Note: I have only tested these demos on 9.0.1
- There are hard coded links to the path xpages\mwlug. You need to place the 3 .nsf files in that path or update the code to your desired path
- Sign the datatables.nsf file. If you are placing the files on a server, sign all 3 databases
- Launch the demo.xsp XPage. This page contains a table of contents of all the demos
I will have the demo database hosted online soon as well.
Online demos can be found here: http://demos.xpage.me/xpages/mwlug/datatables.nsf/demo.xsp
and I plan on adding additional demos to this database as I touch in different topics.
