Flexible View Control for XPages – Adding Subcategories To Categorized Views
Posted: November 30, 2020 Filed under: DataTables, Domino, jQuery, low-code, Uncategorized, XPages | Tags: DataTables, Domino, low-code, XPages Leave a commentWith the last post in the Flexible View Control Series introducing categorized Views, this post is picking right up where that left off and demonstrating how easy it can be to add multiple levels of categorization to a View.
The View Definition
Jumping right in, I’ve created a copy of the ferraris-categorized View Definition used in the previous demo and named the copy ferraris-subcategorized. Since this View Definition is already categorized by MODEL, I want to subcategorize the YEAR column. All I need to do is make a couple of small changes:

- Sort the subcategory column
- Tell the YEAR column to categorize in addition to the MODEL category
- Hide the YEAR column for the detail rows
Displaying the View
For displaying the View I can reuse my viewCategories XPage created for the category demo in the last blog post since it’s configured to dynamically read the View Definition and query from the url QueryString.

Keep in mind … I haven’t altered the back-end View at all. The power is in the View Definition, allowing me to use the same data source to create multiple Views.
See the demo for yourself
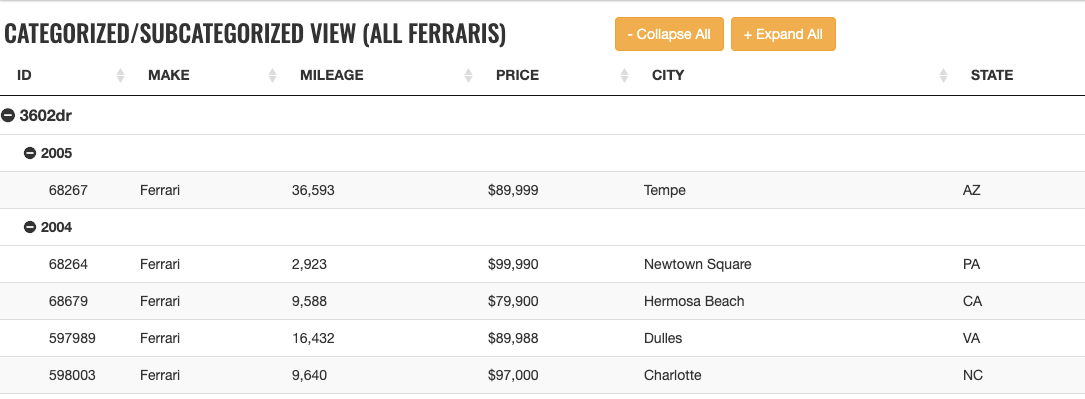
Expanding, collapsing, and filtering all still work as you would expect.

How About More than Two Levels of Categorization?
The Flexible View Control will support as many levels of categorization as you need. The caveat, of course, is all of the categorized columns need to be sorted in the order of categorization.
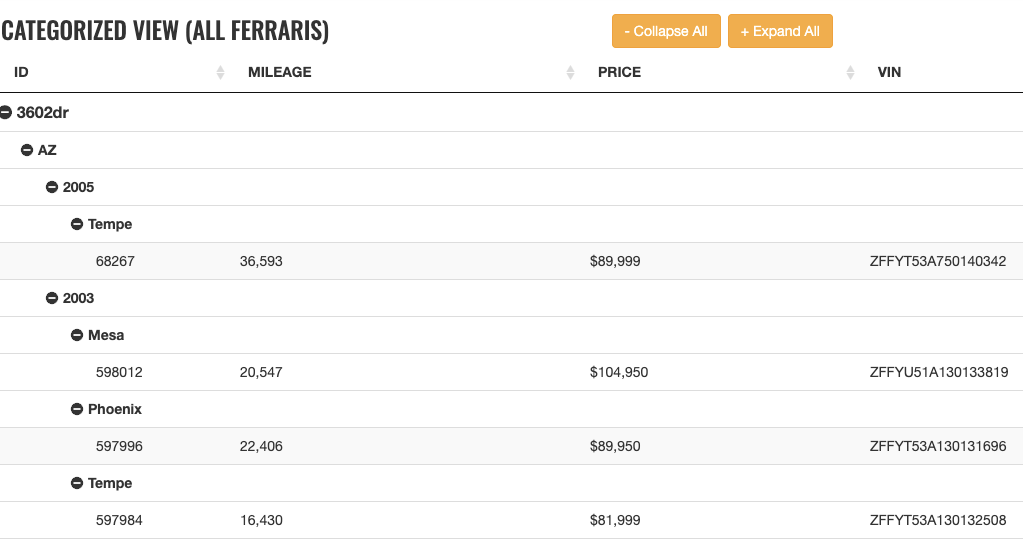
Demo: Three levels of categorization
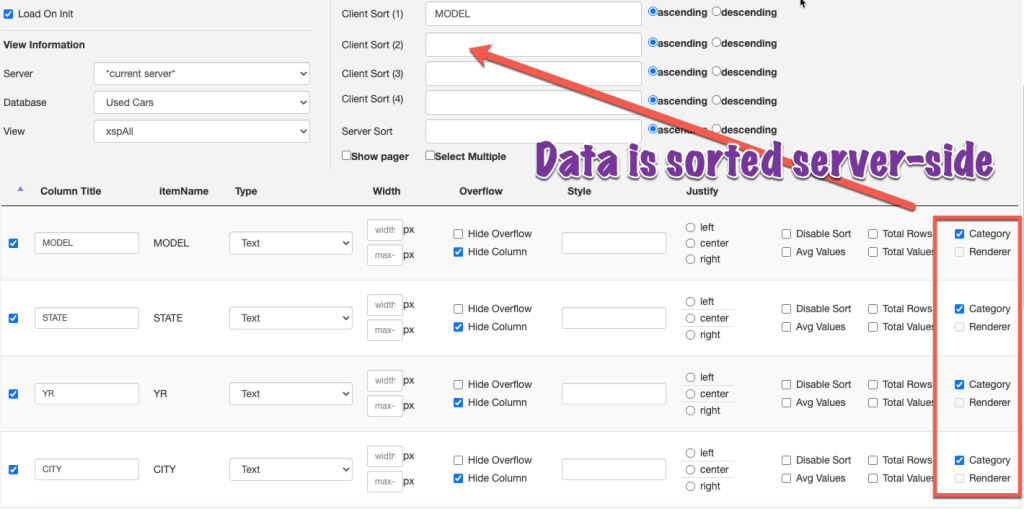
View Definitions currently support four levels of client-side sorting. Alternatively, if the data being sent from the server is already sorted, then theoretically the FVC will support as many levels of categorization as needed.
Note: It’s important to understand the performance implications of using multiple levels of categorization. Every additional level adds an nth degree of speed reduction in rendering the View since categorization is accomplished by traversing the dataset. The more data in the View, the more impact on performance.
Note: For any categorized View, whether the data is sorted sever-side or client side, the first category column needs to be listed in the first client-side sort field of the View Definition. This is an unintended byproduct of the categorization functionality and I will look to remove this requirement in the future
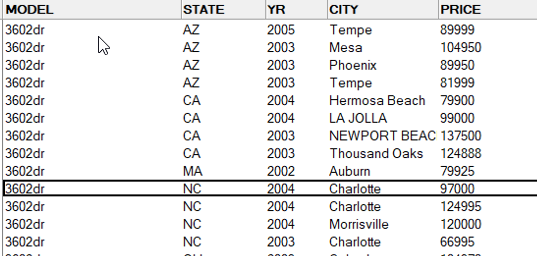
To demonstrate the server-sort, I created a View in the used car database of all Ferraris and sorted the first four columns, By MODEL, By STATE, By YEAR, and By CITY.
Note: The category CSS for the Flexible View Control that handles category indentation only accommodates three levels of categories but its easy enough to add custom CSS for four levels and beyond:
/* level-3 refers to the 4th level since it's
 zero based indexing */
tr.group-level-3 td:nth-child(1) {
    padding-left: 75px;
}

tr[data-category-level="3"] td:nth-child(1) {
	padding-left:100px;
}
Summary
Again, not to beat a dead horse … but flexibility, reusability, and low-code-ability (I think I just made that word up) are qualities that make the Flexible View Control a game-changer for XPage development. The next post will talk about “Category Renderers”, a killer feature to enhance the UI and UX of categorized views.
Flexible View Control for XPages Updates
Posted: November 17, 2020 Filed under: Uncategorized Leave a commentOn the heels of the OpenNTF Webinar where I presented the Flexible View Control for XPages, I was able to make some long-overdue updates that improve the functionality and performance of the control.
Get the code from GitHub:
Updates in this release:
- Improved the setup and configuration process to make it more intuitive, including adding an option to create the default (view-definitions) View Definition automatically.
- Fixed and improved category/sub-category creation and expansion/collapse.
- Cleaned up the View Definition UI.
- Added additional client sorting fields in the View Definition. There is now a total of 4 levels of client-side sorting available.
- Fixed totals options including totaling up for each category/subcategory and showing totals in the footer.
- Added ability to total # of rows or total the values for a column in each row.
- Added a category renderer option to the View Definition.
- Added a footer callback option.
- Reduced expression language evaluations on the ccRestView custom control.
- Added a stats component to the View object to track the performance of different aspects of the control.
The demo site has been updated with the most recent version of the control. Blog posts expanding on/demonstrating the items listed above to follow soon!
Join me for an OpenNTF Webinar on Thu 10/22
Posted: October 14, 2020 Filed under: Uncategorized | Tags: OpenNTF, XPages Leave a commentOn Thursday, October 22nd I will be presenting a webinar for OpenNTF about the Flexible View Control for XPages. Thank you to OpenNTF for the opportunity to demonstrate this content.
For more information and to register for the webinar, visit the OpenNTF website.
For a primer on the Flexible View Control, see the series here:
https://xpage.me/a-flexible-view-control-for-xpages-series/
I look forward to (virtually) seeing you there!
This one trick helps you analyze your Notes data!
Posted: July 17, 2020 Filed under: Uncategorized | Tags: data analysis, Notes Leave a commentCheesy click-bait headline aside, I did recently have a need to analyze millions of records in a database and get a feel for what type of non-alphanumeric characters existed in one field in particular.
What I came up with was an incredibly simple view that gives me a count of how often every combination of English non-alphanumeric characters appears in this one field.
column1: Categorized with the following formula:
str := "abcdefghijklmnopqrstuvwxyz1234567890 ";
@Explode(@Trim(@LowerCase(field_name));@NewLine+str)
column2: Totals column.
The results are… interesting, to say the least.
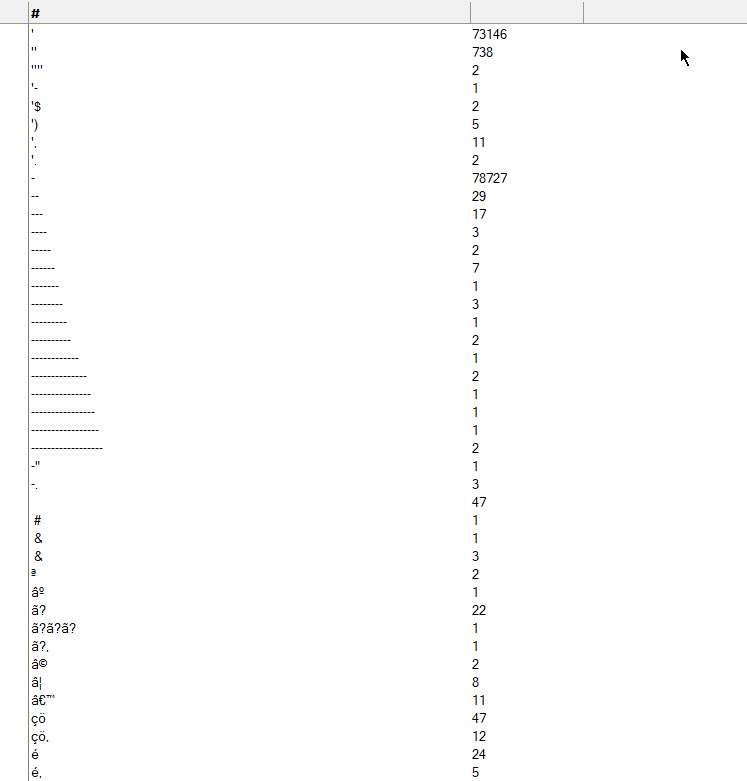
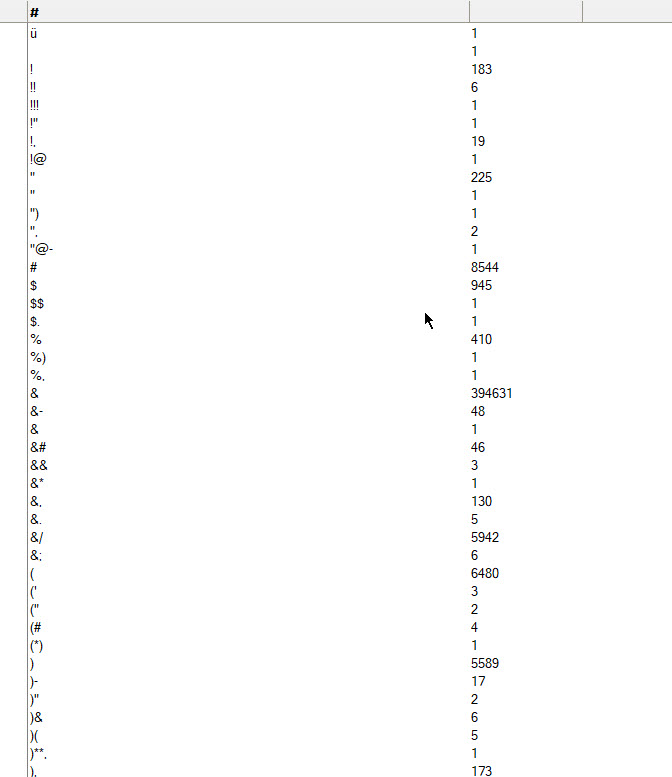
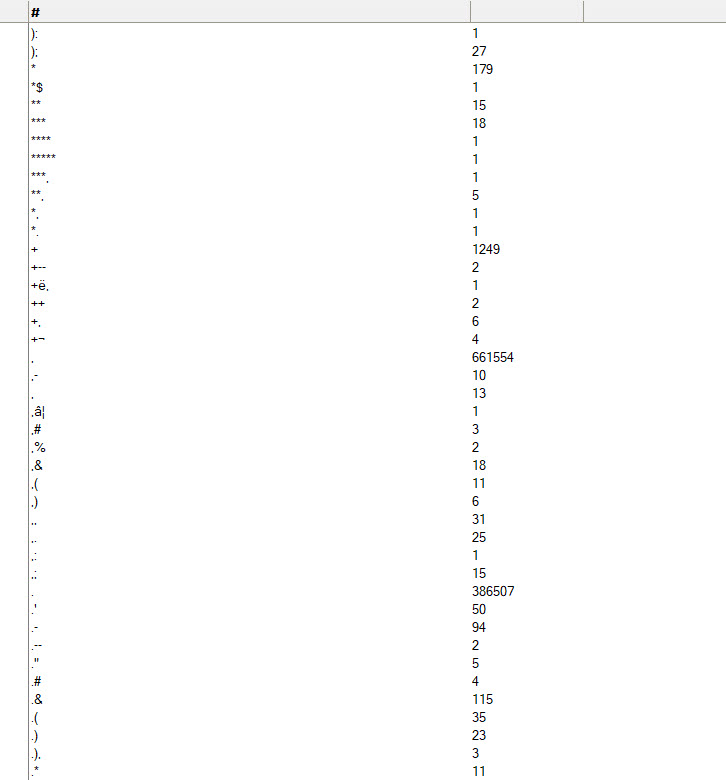

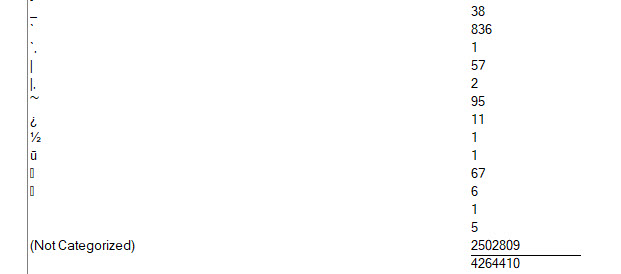
The “Not Categorized” category contains all the documents that do NOT have non-alphanumeric characters in field_name.
This type of analysis can be handy if you don’t have control over the input – for example, if your database contains a large amount of data from external sources or if users do a lot of copy and paste from external emails, Word docs, PDFs, and other files.
CollabSphere 2019 Slides
Posted: November 11, 2019 Filed under: Uncategorized 1 CommentA short few weeks ago at CollabSphere I was fortunate to have the opportunity to present some functionality that I use everyday in the development of the XPage application that powers our entire business.
The session was titled “Real World XPages” and the presentation is now on Slideshare:
In the coming days and weeks I will be expanding on the topics in the presentation (and adding others) as well as making the code and demos available.
Beware the lotus.domino.UserID error in Domino 9.0.1 FP8/FP9 and other upgrade musings
Posted: November 30, 2017 Filed under: Uncategorized 4 CommentsOver the weekend we upgraded our production Domino servers to get to 9.0.1 FP9 HF139(64-bit) & HF137 (32-bit). Well, we “tried” to upgrade the servers.
Then all hell broke loose.
Here’s what we did:
- Server1
- Primary XPages server with NIFNSF enabled.
- Upgrading from FP8 HF174 to FP9
- Upgrade failed with error “Installer found the incorrect version…”.
- Server2
- Backup XPages server.
- Upgrading from FP6 to FP9.
- Upgrade failed with error “Lotus Notes/Domino or a Notes/Domino related process is still running”.
- Booted into Safe Mode and installed FP9 and HF62
- Upgrade to FP9 HF137 failed with error “Installer found the incorrect version…”
- Applied JVM Patch 1_8SR4FP10
- Server3
- Emergency XPages server.
- Upgrading from FP1 to FP7 (in the event there were issues with FP8/FP9 – this ended up being a saving grace)
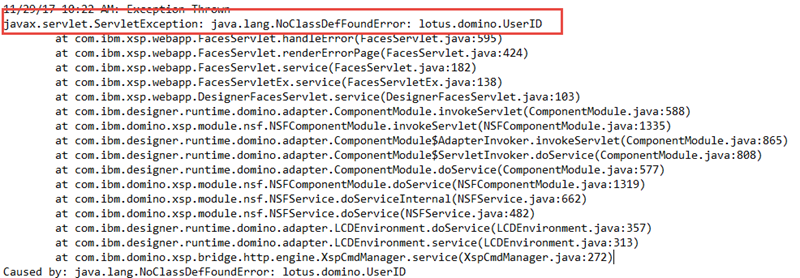
After upgrading Server2 and attempting to upgrade Server1, both servers started throwing the following exception when attempting to open any Xpage with a document data source:
javax.servlet.ServletException: java.lang.NoClassDefFoundError: lotus.domino.UserID
The only reference I could find to this specific issue was from this question on server fault.
In addition, Server1 started crashing any time we opened databases in the Notes client and started throwing long held lock dumps … over and over and over again: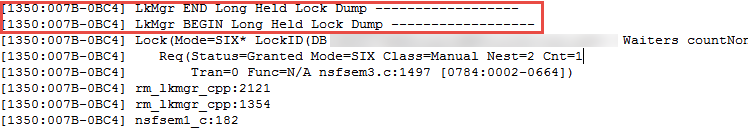
Not sure if this was being caused by NIFNSF being enabled on the server? Watching the view indexes on disk, the server was leaving 100s and then 1000s of temp .ndx files on disk as the server crashed over and over again.
Luckily, we intentionally upgraded Server3 to only FP7 in the event that we had issues with the other servers. This saved our ass as we were able to point our users to this server with minimal interruption as we dealt with the issues above.
We were finally able to get Server1 & Server2 upgraded to FP9 HF60.
Here is what we learned in the process:
- If you are receiving the exception “javax.servlet.ServletException: java.lang.NoClassDefFoundError: lotus.domino.UserID” when opening an XPage with a document data source, then the JVM is probably hosed. Once we were able to successfully upgrade to FP9 HF60 then everything was fine, but it doesn’t explain why this issue started on a server where the upgrade process failed initially.
- If, when trying to install a fixpack/hotfix you get the message “Error installing Domino Fixpack: Installer found the incorrect version. . .” then you probably need to install the base version of Domino, in our case 9.0.1 and then the FP you are trying to get to plus the HF you are trying to get to. This is detailed in this technote.
- If, when trying to install a fixpack/hotfix you get the message “Lotus Notes/Domino or a Notes/Domino related process is still running…” then you may need to disable the “Windows Management Instrumentation Service” in the Services list of the server. We PAUSED the service and successfully upgraded the server. See this technote.
Questions from the DataTables Webinar
Posted: October 18, 2016 Filed under: Uncategorized Leave a commentLast Tuesday I presented a Webinar on using DataTables with XPages which was hosted by TLCC and Teamstudio. There was a Q&A at the end of the session, but unfortunately due to time constraints we did not get to all of the questions and kind of rushed through the questions we did get to. So I wanted to dedicate a blog post to answering all of the questions that were submitted. Here we go!
Q1: (Submitted by Jena Chinmaya) – Can we use Data table of this format on a regular non xpage classic notes web database ?
A1: Absolutely! A lot of the concepts that were discussed would still apply in a classic Domino Web scenario. The big question that would have to be answered is, how is your data being delivered from the back end to the front end? If you are using a more recent version of Domino (say, 8.5.3 or greater) then you can create an XPage with a REST service control. If you are using an older version of Domino, then you still have a few different options:
- Using a $$ViewTemplateDefault form to display the view. This would be similar to using a xp:repeat in XPages since you would be applying DataTables to an existing html table of data. I created a quick demo so you can get an idea how this would function.
- Use an agent to deliver view data via REST
- Use ajax to get data using the ?readviewentries&outputformat=JSON option of a view url. This method would require some additional work in DataTables to read the data.
Q2: (Submitted by Chris Richards) Could you, using REST services – create one custom control, which you can drop anywhere, and just pass in a cusotm property, namely a view name so that it can be drag/dropped/re-used all over an application with ease?
A2: This can definitely be accomplished and is a great way to make adding view data as simple as drag and drop. I essentially do this now through an extremely configurable custom control. The key to success is making sure that the columns object gets properly defined if you are using JSON data. I hope to make my solution available in the very near future and I’m contemplating a “light” version that I can get out quicker.
Q3: (Submitted by Csaba Kiss) Do you see any performance difference using custom REST service vs standard JSON REST?
A3: While I have not done a direct performance comparison of these REST services, I think it’s reasonable to assume that the more “custom” the custom REST service is, the more it will slow down vs the standard REST service. For example, if while processing each row you are looping through column values to perform actions, you can certainly expect a performance hit. If the custom REST service is just traversing a view, then I would expect the performance to be similar to the standard REST service.
Q4: (Submitted by Jen Watkins) how does one format dates? The format that comes back by default from DataTables is crazy.
A4: I think the format you are referring to is the ISO-8601 format, which you can see in the screenshot below. Actually, this format is being delivered by Domino. You can see this at the bottom of the screenshot in the REST response.
There are a few ways to deal with this:
- When working strictly with dates, my personal preference is to just format the column as text in the view. DataTables recognizes the value as a date and column sorting will work appropriately.
- You can use a renderer to format the date to your preferred format. Here is a great post on the DataTables website demonstrating how to do so. This post references the moment.js library. I use this library as well and it makes working with dates incredibly easy, especially when doing date comparisons.
Q5: (Submitted by Jen Watkins) To filter data before it is returned, for example to return only the data that a particular user is allowed to see, do you have to use the CustomRestService as opposed to the ViewJsonService?
A5: The answer to this question depends on how you have security setup in your application. If your users are authenticating and they are calling REST services that are retrieving data from databases that require authentication, then the appropriate records will be returned based on Domino security.
On the other hand, if you are no so much concerned about security, but want to only show, for example, documents that are assigned to the current user, you can sort or categorize your view on the back end and submit the “keys” attribute with the REST service and the dataset returned will be filtered. You can actually get very creative with using categorized/sorted views to get away from the old Notes habit of having a different view for every different categorization/sort.
Q6: (Submitted by Kevin Gregg) What if you needed to combine data from multiple views into one DataTable – what is a good method of doing that?
A6: When answering this question during the webinar I may have misunderstood the intention of the question so I will answer it in two ways. This question can be interpreted in 2 ways:
- You want to add additional rows – I actually do this a lot. We have 2 databases that store almost identical information. In classic Notes land, we would have to show separate views and embedded views when displaying this information to the user.With DataTables it is very easy to combine data sets, as long as the configuration of the data sets match. What I do is load the initial data, then in the initComplete callback I make an ajax call to the 2nd set of data and then use the add rows functionality of DataTables to merge the data:
initComplete: function() {
// Check for any other data sets that need to be added to the table
$.ajax({
    type: 'GET',
    url: <url to REST service>,
    contentType: 'application/json',
    dataType: 'json',
    cache: false,
    success: function(response) {
                var vTable = $(dataTableClass).DataTable();
                vTable.rows.add(response);
                console.log("init adding records");
                console.log("initComplete draw()")
                vTable.draw();
   }
});
}
- you want to add additional columns – This is akin to having a xp:repeat control and having a column where you perform a @dblookup to another set of data based on information in the original set. For this scenario, the best course of action is probably to use a custom REST service or an XAgent to build the data set on the back end and deliver the completed set to DataTables.
However, you could also accomplish this in DataTables. In your original data set you could have one or more empty cells acting as placeholders. Then, similar as in #1 above, in your initComplete callback you can make an ajax call to another set of data and then using a shared key between the two, insert the retrieved data into the DataTable. I will try to work up an example of this once I can find a few minutes.
Q7: (Submitted by Miguel Angel) How I can lock a document from a datatable to prevent the save replication conflict? How I can show a online message from a Datatables, when a customer made a change at that moment?
A7: The lack of Document locking was certainly one of the early complaints of XPages. Ultimately, people worked around it or rolled their own document locking mechanism. Some of the solutions out there include:
- An OpenNTF project from Frederick Nordling
- This post from StackOverflow
- In our environment, we created our own document locking solution. We needed to do this because we had users that were updating documents in the Notes Client as well as our XPages application.
To relate this to DataTables, if you want to initialize a lock from DataTables, you can do this by adding an onclick or ondblclick event that submits information, such as docid, to a REST service. To release the lock, you would do the same.
To answer your 2nd question, I’m assuming you want to update the current user if data they are looking at was changed in the back end by someone else. Here’s what I think the simplest solution is:
- Add a setInterval to the initComplete callback that retrieves the REST data (or maybe just retrieves a column with date modified value).
- Loop through each record and compare the values to the original DataTable (or compare the date modified column).
- If there is a difference, notify the user. If you are using Bootstrap you can use the alert classes to display a message above the table, for example.
Upcoming Webinar: XPages and jQuery DataTables
Posted: October 4, 2016 Filed under: Uncategorized 6 CommentsJoin me next Tuesday, October 11th for a webinar sponsored by TLCC and Teamstudio – “XPages and jQuery DataTables – Simplifying View creation while maximizing functionality”
In this webinar I will show you how you can use DataTables to create rich, functional views, which is especially relevant if you are modernizing or rebuilding an existing Notes application. While the title references XPages, it is not a requirement. DataTables is compatible with any back end that can deliver data via REST.
You can register here:
https://www.tlcc.com/admin/tlccsite.nsf/pages/xpages-webinar?opendocument
I hope to see you there!
Adding icon columns to DataTables with FontAwesome
Posted: September 14, 2016 Filed under: Uncategorized Leave a commentIf you are modernizing a Notes/Domino application, chances are there are many underlying views that make use of column icons, which have always been one the great little features that users really loved about Notes. As Domino web apps became more prevalent, you could even create img tags that pointed to the icon source files on the server (oooohhhh!).
In the modern app world you are probably using icons that are more … modern, such as Font Awesome.
If you are using jQuery DataTables as well, then it is incredibly easy to add much more functional column icons to your DataTable using a Renderer.
Note: this article assumes the reader has an understanding of how a DataTable is configured using the columns object.
For a primer, refer to my MWLUG session slides, the accompanying demo database, the online demos, or the DataTables website. This example builds on the demos.
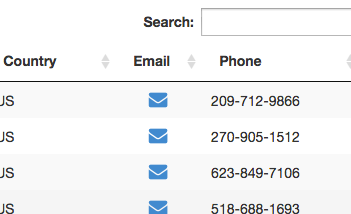
The example below takes the email column and turns it into an icon that, when clicked, will launch a new mail message addressed to the person listed on that line.
We want to turn this:

Into this:
1.) Setup the view data source that feeds the DataTable.
This can be done by adding a new column to the datasource that contains a JSON string. This is personal preference – you can setup the column however you wish. The important thing is passing the data needed to render the icon to DataTables.
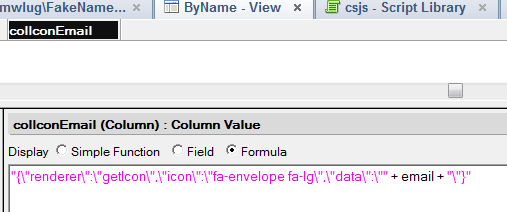
The JSON string in my new column has three properties:
- renderer – has the value “getIcon”.
- icon – this property contains the class(es) of the Font Awesome icon to be used.
- data – this is the raw email address. We want to include this for filtering and sorting.
2.) Now that the data source is setup, update the columns object of our DataTables initilization:
In previous examples our columns object looked like this:
var columns = [
{
	data:"colName", // which property in the json object to pull data from
	title:"Name"	// text to appear in the column header
},
{data:"address",title:"Address"},
{data:"city",title:"City"},
{data:"state",title:"State"},
{data:"zip",title:"Zip"},
{data:"country",title:"Country"},
{data:"email",title:"Email"},
{data:"phone",title:"Phone"}
];
Now, we are replacing the “email” entry with a new entry that will render the Font Awesome icon by using the “render” property of the columns object:
var columns = [
{
	data:"colName", // which property in the json object to pull data from
	title:"Name"	// text to appear in the column header
},
{data:"address",title:"Address"},
{data:"city",title:"City"},
{data:"state",title:"State"},
{data:"zip",title:"Zip"},
{data:"country",title:"Country"},
{data:"colIconEmail", // this is replacing "email"
 title:"Email",
 width:"50px",
 render:function(data, type, row, meta) {
	// check to see if this is JSON
	try {
	   var jsn = JSON.parse(data);
	} catch(e) {
	   console.log("error parsing json - " + e.toString());
	   return jsn.data;
	}

	if (type == "display") {
		// this is the value that will be used to display what
		// the user sees

		// we want to display a clickable icon
		if (jsn.renderer == "getIcon") {
			// first get the font awesome markup
			icon = "<i class='fa " + jsn.icon + "'></i>"

			// second, wrap some additional markup to provide
			// formatting and click, etc.
			return "
”
		}
	} else {
		// this is the value that will be used for everything
		// else - filtering, sorting, etc
                // i.e. user@mail.com
		return jsn.data;
	}

 }
},
Our view that utilizes the renderer now shows an icon in the email column:
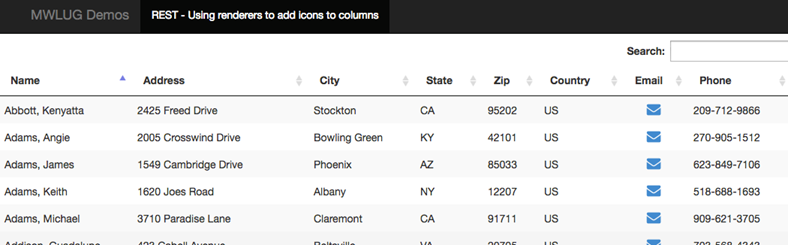
Clicking on one of the mail icons launches a new memo:

Even though our email column is now displaying an icon instead of an email address, we can still filter on email address due to DataTables’ handling of orthogonal data. By filtering on the domain spambob.com, we get only the records that have an email address with that domain.

The working demo for this example can be found here.
Even though this is a fairly basic example, it is incredibly easy to add icons to views created with DataTables – it was simply 2 additional steps. This is only the tip of the iceberg for both Renderers and View Icon Columns.
Demo database from my MWLUG session
Posted: September 8, 2016 Filed under: Uncategorized 7 CommentsAt MWLUG in August, I presented on using jQuery DataTables with XPages. I finally got the demo database(s) I used in the presentation tidied up and ready for download. Some additional demos have been added since MWLUG.
Better late than never, right?
Get the download here: mwlug-demos
Contents of the zip file:
| datatables.nsf | Contains all demo XPages, resource files, and scripts |
| rest.nsf | Contains REST services and XAgents used by DataTables |
| fakenamesdemo.nsf | Data source – this is the Fake Names database made available by David Leedy. Some modifications have been made for the purpose of these demos |
To get the demo database working:
- Note: I have only tested these demos on 9.0.1
- There are hard coded links to the path xpages\mwlug. You need to place the 3 .nsf files in that path or update the code to your desired path
- Sign the datatables.nsf file. If you are placing the files on a server, sign all 3 databases
- Launch the demo.xsp XPage. This page contains a table of contents of all the demos
I will have the demo database hosted online soon as well.
Online demos can be found here: http://demos.xpage.me/xpages/mwlug/datatables.nsf/demo.xsp
and I plan on adding additional demos to this database as I touch in different topics.
