Humbled to be an HCL Ambassador for 2021
Posted: December 15, 2020 Filed under: Domino, HCL | Tags: Domino, HCL, HCLAmbassador 1 CommentHCL has announced the HCL Ambassador Class of 2021 and I’m very honored to be on this list for the first time.
The HCL Ambassadors Program recognizes customers and partners who go above and beyond to promote HCL Software products, engage with the community, and help others.
Thank you to those who nominated me, and to HCL for selecting me based on the criteria above. We’ve all had enough of 2020 at this point, so here’s to 2021!
Flexible View Control for XPages – Mashing Up Total Columns and Category Renderers
Posted: December 14, 2020 Filed under: DataTables, Domino, JavaScript, jQuery, low-code, XPages | Tags: DataTables, Domino, JavaScript, jQuery, low-code, XPages 1 CommentIn a recent blog post we covered the concept of ‘Category Renderers’, which allows the user to easily alter the visual representation of category rows in a categorized View. Combining this functionality with totals columns, highlighted in the last blog post in this series, we can further enhance Views in XPages and make them more user-friendly than their Notes counterparts.
The Mission
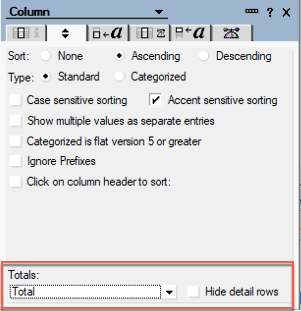
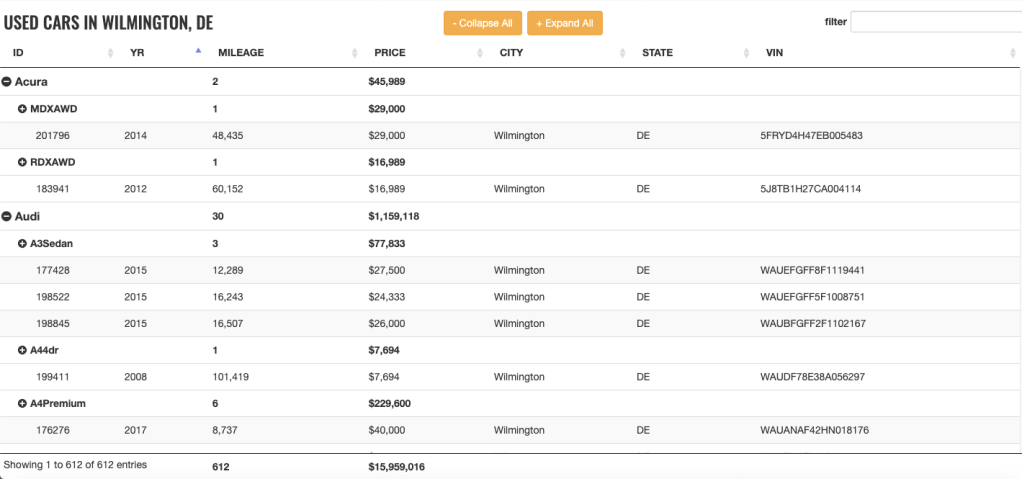
Continuing with our dataset from previous posts of used cars available in Wilmington, DE I want to display the average PRICE of each MAKE of vehicle. In my View Definition I categorize the MAKE column:
Note: As you can see in the screenshot below, the View Definition has an option to display average values. This option currently doesn’t function properly and will be updated in the next release.

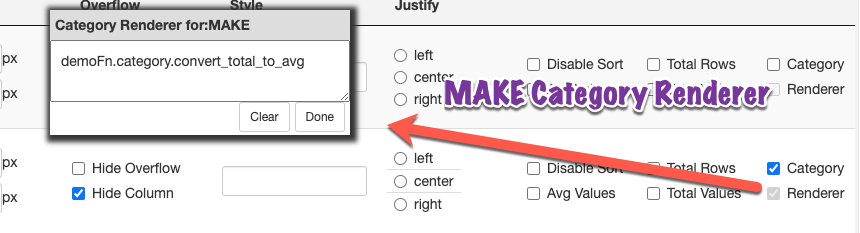
Then I add a Category Renderer to the MAKE column:
And I still have totals enabled for PRICE and MILEAGE:

The Category Renderer
The demoFn.category.convert_total_to_avg function is a function in a client-side js library. Remember, you do not provide any parameters to the function. This function is applied to every category row and the dom object for that category is automatically passed into the function as a parameter.
convert_total_to_avg : function(_this) {
	// _this is the category row dom element
	// take a total value for a category and instead display the avg value

	// get the total # of rows for this category
	var total_rows = $('.total_rows',$(_this)).html();

	// get the total PRICE for this category
	var total_value = $(_this).attr('total_price_values');

	// format the column that contains the total #
	$('.MILEAGE_total',$(_this)).html(total_rows+' (total)');

	// calculate and format the average price
	$('.PRICE_total',$(_this)).html('$'+$U.formatMoney((total_value/total_rows),0)+' (avg)');
}
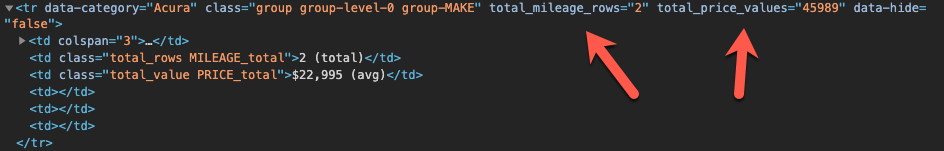
Notice in the code above we are extracting the total_value from the attributes of the category tr. We are able to do so because when totals are enabled for a categorized column the Flexible View Control stores the accumulated data in the tr element for easy access:
The Result
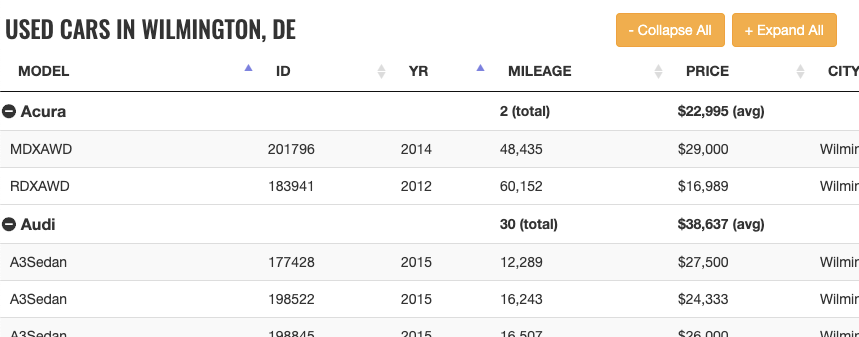
Here is our result:
What About The Footer?
While we are achieving the desired outcome for each category, the footer still displays the total PRICE for all used cars in Wilmington, DE.

How do we get the average price for all used cars instead? In the next post we’ll show you how!
Flexible View Control for XPages – Adding Column Totals
Posted: December 7, 2020 Filed under: DataTables, Domino, low-code, XPages | Tags: DataTables, Domino, low-code, XPages 1 CommentWhen building Views in the Notes Client adding totals to one or more columns is a pretty common occurrence.
Does the Flexible View Control for XPages support column totals? Absolutely!
As usual, the power is in the View Definition
The Flexible View Control provides two options for displaying totals in View columns:

Total Rows
This option simply does what you would expect – totals the number of rows. This is equivalent to creating a column in a View, hard coding a ‘1’ for the value, and telling the column to total the values. Another advantage of the Flexible View Control … there is no need to create a special column to display the total rows and no need to worry about selecting the ‘hide detail rows’ option to hide all those 1s in your View. Instead, simply pick any column, turn on Total Rows, and the total will display at the bottom of that column.
Total Values
Again, this option does exactly what you would expect it to do and adds up the value contained in each row and displays the total in the footer at the bottom of the View.
Building A Demo
To get started with a demo for this post I created brand spanking new View Definition called wilmington-de-totals, pointed it to the same View in the Used Cars database I’ve used for most of the other demos, and selected all of the data columns. To show Total Rows, I select that checkbox for the MILEAGE column and to show Total Values, the PRICE column.
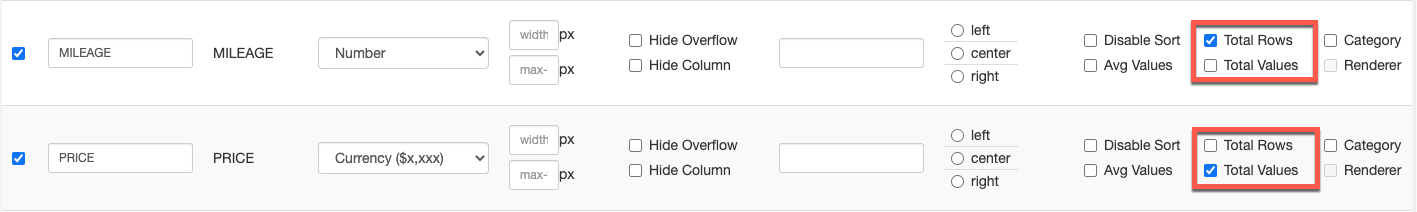
Did you notice … the total value displayed in the PRICE column is formatted as currency to match the data type of the values in the individual rows.
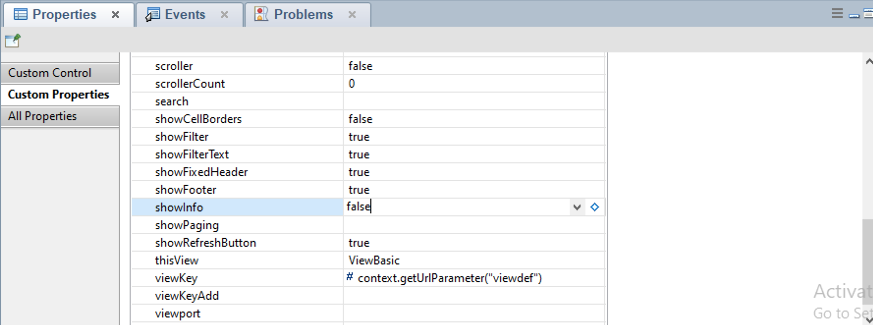
An argument could be made that the Total Rows option is not needed since we have the DataTables info box in the bottom left corner. However, the Flexible View Control has a custom property that controls whether the info section is displayed, or not. So some may opt to turn it off and display the total rows under a column.
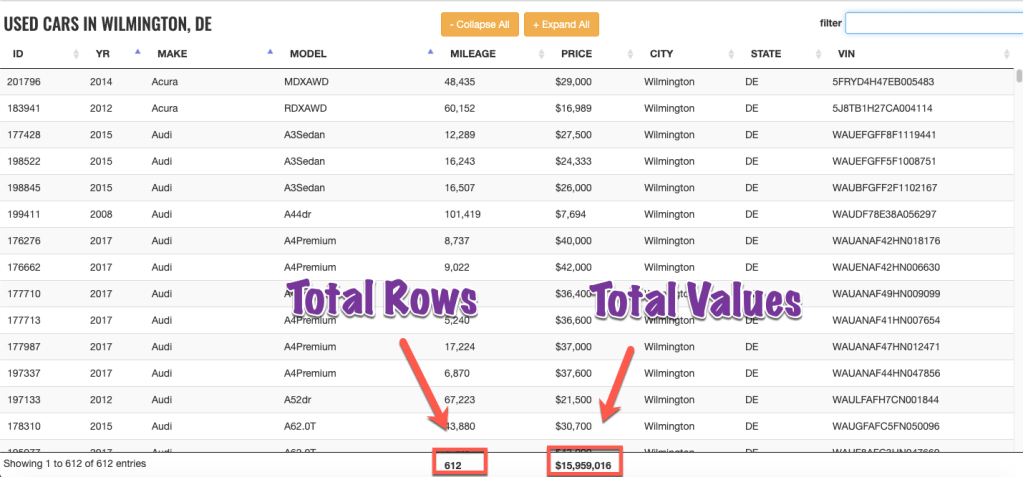
Here’s what it looks like:

What About Filtering?
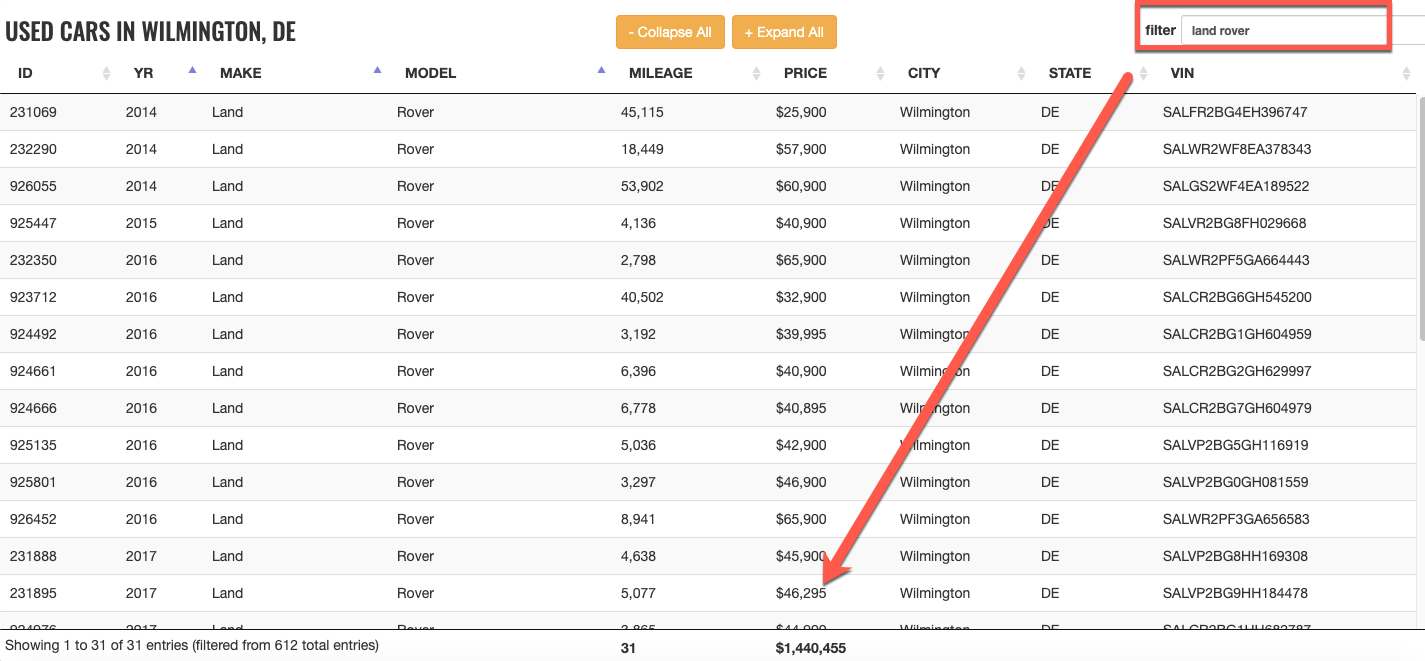
What happens if you enter a value in the search box and filter the view based on that value? The totals displayed reflect the filtered value. In the example below, I searched for all of the Land Rovers. The total PRICE contains values only for the Land Rovers, as does the Total Rows displayed under the MILEAGE column.
Category Totals
One of the great, unique features of Notes Views is the ability to have total columns in a categorized View and display totals for each category in addition to the full column total. With the Flexible View Control, when either of the totals options is enabled, categorized Views will also display the totals for each category by default:
Summary
Organizations that have been Notes/Domino shops and start to move their apps off of the Notes Client and into the browser still expect some of the standard functionality provided by Notes Views. The Flexible View Control for XPages strives to meet those expectations and also to exceed them by providing additional functionality that we, as developers, were not able to provide for our users within the Notes Client.
In the next blog post we will take the Totals functionality a step further and mash it up with the Category Renderer functionality from a previous post to show how to create richer Views for our users.
Flexible View Control for XPages – Category Renderers
Posted: December 2, 2020 Filed under: Bootstrap, DataTables, Domino, JavaScript, low-code, XPages | Tags: DataTables, Domino, JavaScript, low-code, XPages 1 CommentWhat is a Renderer?
In the DataTables world, “Renderers” play an important role in creating the visual representation of a table. In fact, behind the scenes the Flexible View Control uses Renderers to display all of the data in a View. In the future, I will be posting about creating custom renderers to further enhance the Flexible View Control, but this post focuses on “Category Renderers” in keeping with the category/subcategory theme of recent posts.
Technically speaking, Category Renderers are not the same as standard DataTable Renderers. But the concept is the same – taking a data input and altering the output that is presented to the user.
Building a Category Renderer Demo
Let’s pick up where we left off in the previous post with our subcategory demo. I made a copy of the View Definition used in this demo and called it ferraris-category-renderer. Take look at the MODEL column:

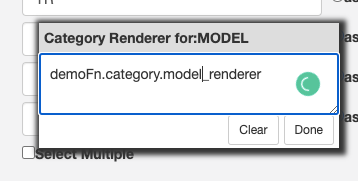
Underneath the category checkbox is another checkbox labeled “Renderer”. Clicking this reveals a pop-up window:

In this box I can enter a function string without parameters in the same way that callback functions are configured in the FVC custom properties. If a value exists in this box, then after the categories are drawn in the DataTable, the dom element for each MODEL category row is passed into the function defined in the category renderer box:
 // does this group need a renderer?
if (o.columnCategory[x].categoryRenderer != null && o.columnCategory[x].categoryRenderer != "" ) {

	$('.group-'+o.columnCategory[x].itemName).each(function() {

		var fnstring = o.columnCategory[x].categoryRenderer;
		if ((typeof fnstring) == "undefined" || fnstring == null) {
			return;
		}
		if (fnstring.indexOf('.') > -1) {
			var fn = window.getFunctionFromString(fnstring);
		} else {
			var fn = window[fnstring];
		}

		// is object a function?
		if (typeof fn === "function")  {
			fn(this);
		} else {
			console.log("renderer error")
			return;
		}
	});
}
In the screen below I’ve entered a function name into the category renderer box. This is just a client-side JavaScript function that lives in a demos script library.
Category Renderers are JavaScript functions
Starting simple, I’m just going to change the font for the MODEL category row. *Technically* this should be done with CSS instead of a renderer, but it’s fine for a simple example:
model_renderer : function(_this) {
	// _this is the row dom element
	console.log('category renderer')
	$(_this).css({
		'font-family':'Oswald',
		'font-size':'1.25em'
	})
}
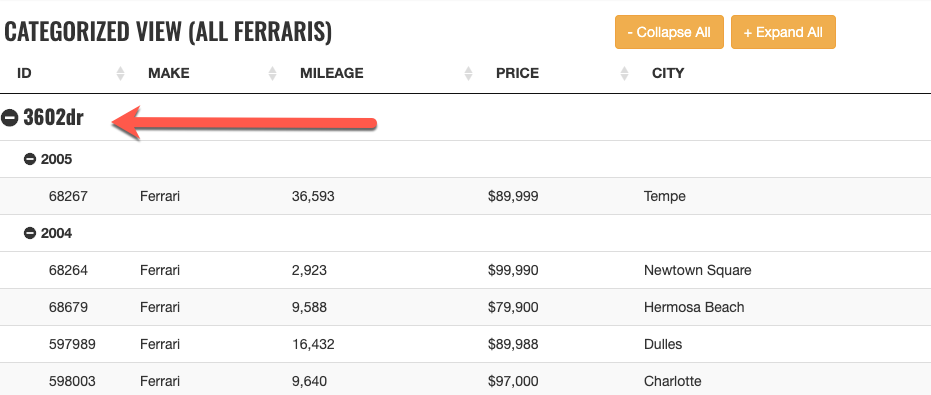
A more practical use for the category renderer is to manipulate the dom node for the category. For this next example I’m going to wrap the category value in a Bootstrap label:
model_renderer : function(_this) {
	// _this is the row dom node

	$(_this).css({
		'font-family':'Oswald',
		'font-size':'1.25em'
	});


	// add a Bootstrap label
	var v = $('.group_value',$(_this)).text();
	$(_this).find('.group_value').addClass("label label-success")

}
Checkout the demo: http://demos.xpage.me/demos/datatables-xpages-bootstrap.nsf/viewCategories.xsp?viewdef=ferraris-category-renderer&key=make:ferrari

Summary
In summary, Category Renderers can be a valuable, low-code tool that adds functionality to Views created with the Flexible View Control for XPages and provide a more rich experience for your users.
