Flexible View Control for XPages – Mashing Up Total Columns and Category Renderers
Posted: December 14, 2020 Filed under: DataTables, Domino, JavaScript, jQuery, low-code, XPages | Tags: DataTables, Domino, JavaScript, jQuery, low-code, XPages 1 CommentIn a recent blog post we covered the concept of ‘Category Renderers’, which allows the user to easily alter the visual representation of category rows in a categorized View. Combining this functionality with totals columns, highlighted in the last blog post in this series, we can further enhance Views in XPages and make them more user-friendly than their Notes counterparts.
The Mission
Continuing with our dataset from previous posts of used cars available in Wilmington, DE I want to display the average PRICE of each MAKE of vehicle. In my View Definition I categorize the MAKE column:
Note: As you can see in the screenshot below, the View Definition has an option to display average values. This option currently doesn’t function properly and will be updated in the next release.

Then I add a Category Renderer to the MAKE column:
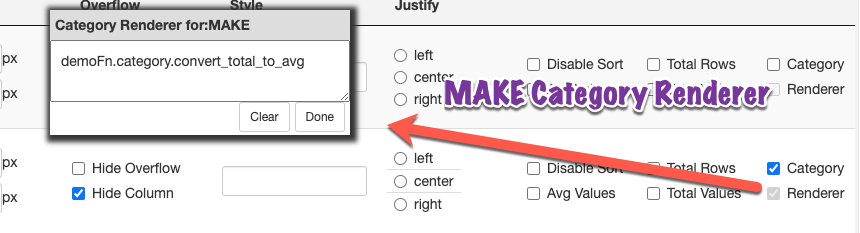
And I still have totals enabled for PRICE and MILEAGE:

The Category Renderer
The demoFn.category.convert_total_to_avg function is a function in a client-side js library. Remember, you do not provide any parameters to the function. This function is applied to every category row and the dom object for that category is automatically passed into the function as a parameter.
convert_total_to_avg : function(_this) {
	// _this is the category row dom element
	// take a total value for a category and instead display the avg value

	// get the total # of rows for this category
	var total_rows = $('.total_rows',$(_this)).html();

	// get the total PRICE for this category
	var total_value = $(_this).attr('total_price_values');

	// format the column that contains the total #
	$('.MILEAGE_total',$(_this)).html(total_rows+' (total)');

	// calculate and format the average price
	$('.PRICE_total',$(_this)).html('$'+$U.formatMoney((total_value/total_rows),0)+' (avg)');
}
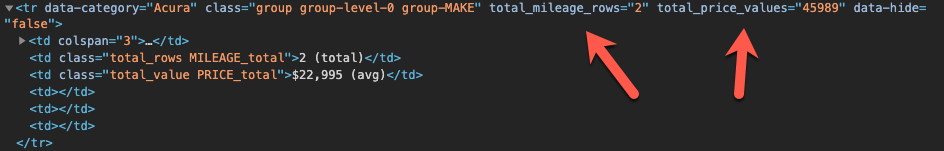
Notice in the code above we are extracting the total_value from the attributes of the category tr. We are able to do so because when totals are enabled for a categorized column the Flexible View Control stores the accumulated data in the tr element for easy access:
The Result
Here is our result:
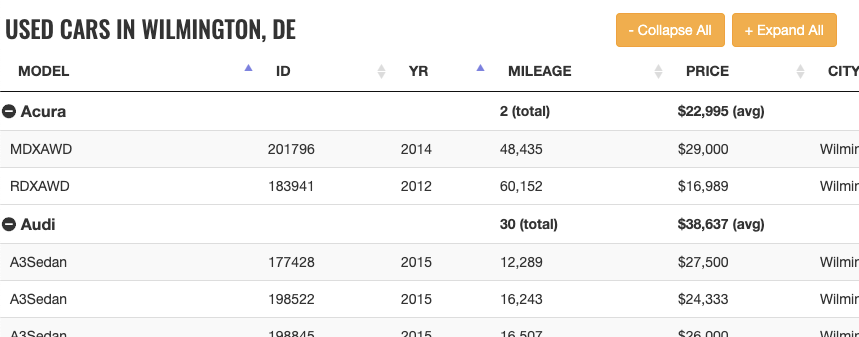
What About The Footer?
While we are achieving the desired outcome for each category, the footer still displays the total PRICE for all used cars in Wilmington, DE.

How do we get the average price for all used cars instead? In the next post we’ll show you how!

Hi Michael!
Great job!
Sorry to bother you, could you please tell how I can use icons in a column (how to display a specific icon in a column, depending on the value in that column)
With great respect,
LikeLiked by 1 person